It took almost a month to finish writing my first log, which is not really ideal when the plan was to write about once a week or two. It’s not as easy when you aren’t used to writing, along with trying to pack it in a pretty busy schedule between 5:30 AM to 9:40 PM. The progress on the projects and studies slowed down as well trying to write this, so it wasn’t particularly a productive month. Hopefully I get this done quicker this time.
Ever since I started ‘Bank Account Interest Calculator Development’ I didn’t touch on ‘Kivy module study’, because I was sure I’d get it over with in few days. Jokes on me, I’m terrible at focusing on one thing and now I’m almost two months in. However, I do have something other than ‘Bank Account Interest Calculator Development’ to talk about in this post;
- Bank Account Interest Calculator Development
IEEE 754 double precision floating point(Not enough time)
1. Bank Account Interest Calculator Development
This project continued for more than a day because I thought my code’s result was wrong. It took me 15 days to figure out that it was right all along, but by then the project became more than just to find the result, but to see how far I can optimize my code while following & learning common programming conventions.
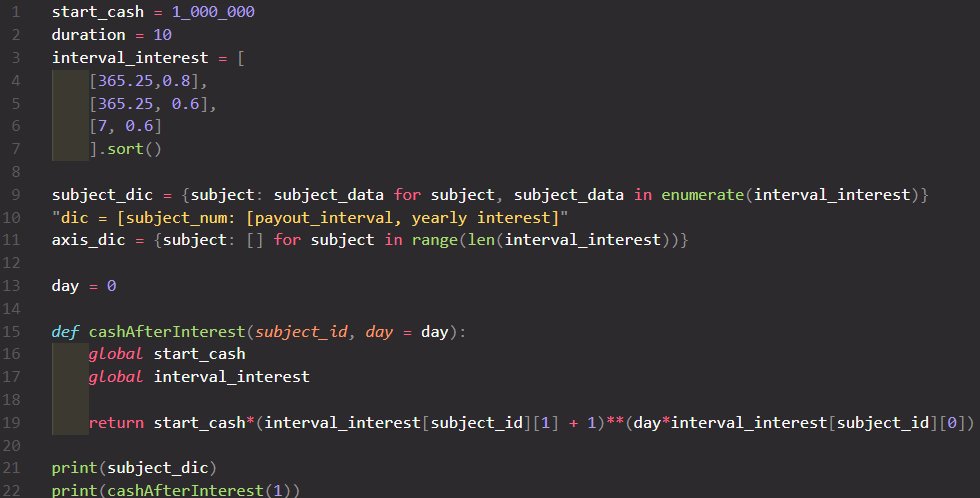
In my last post’s last image, I put .sort() at the end of the list assigned to variable interval_interest. This was to sort the items in ascending order based on item[0], which is important for a later process.

But then I’d get this error on line 9:
TypeError: object of type 'NoneType' has no len()Later I found out that removing .sort(), and writing interval_interest.sort() below works as initially intended. I don’t fully understand why, but this wasn’t the first function that required the data type to be assigned to a variable and passed on the variable itself.
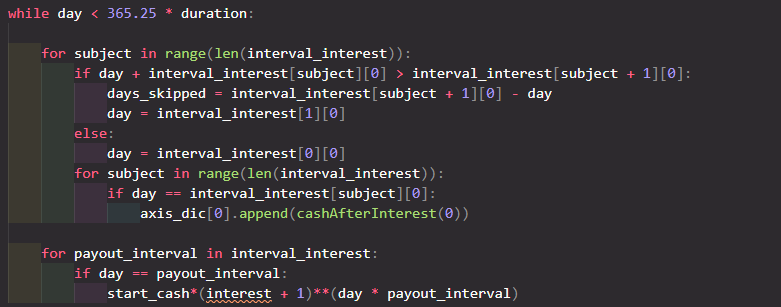
I also briefly talked about utilizing dictionaries for storing values, and - while it’s great - that it’s hard to tell what value each index of the dictionary means. Take a look at the image below as an example.

Even for myself, this was hard to look at as I need a moment to remember what interval_interest[1][0] means, and not to confuse it with interval_interest[0][1]. Later I decided this isn’t how I should represent these data. I should define each as a function.

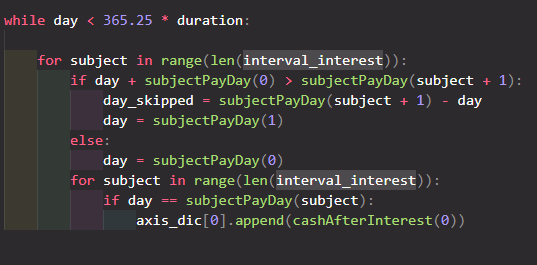
This made the code look much, much better.

I have a bit of an issue with functions, however. I don’t know if I should have constants/out-of-local variables called as arguments, or called as global. The constant in this case being interval_interest. I called it as an argument for now, but now that I think about it as I’m writing this, it makes more sense to call it as global, since no argument other than subject should be available to change.
Now finally to talk about how this code differs from the first one; It’s the same in the perspective of drawing the graph, where x-axis only draws if there is a change in y-axis for any of the subjects. The difference is that the calculation for the next y-axis is separate from the calculation for the next x-axis. This is why you see cashAfterInterest() in a different for loop (though in these screenshots the second for loop nested in the first one for some reason)
You can click here to read the code as of Jul 19.
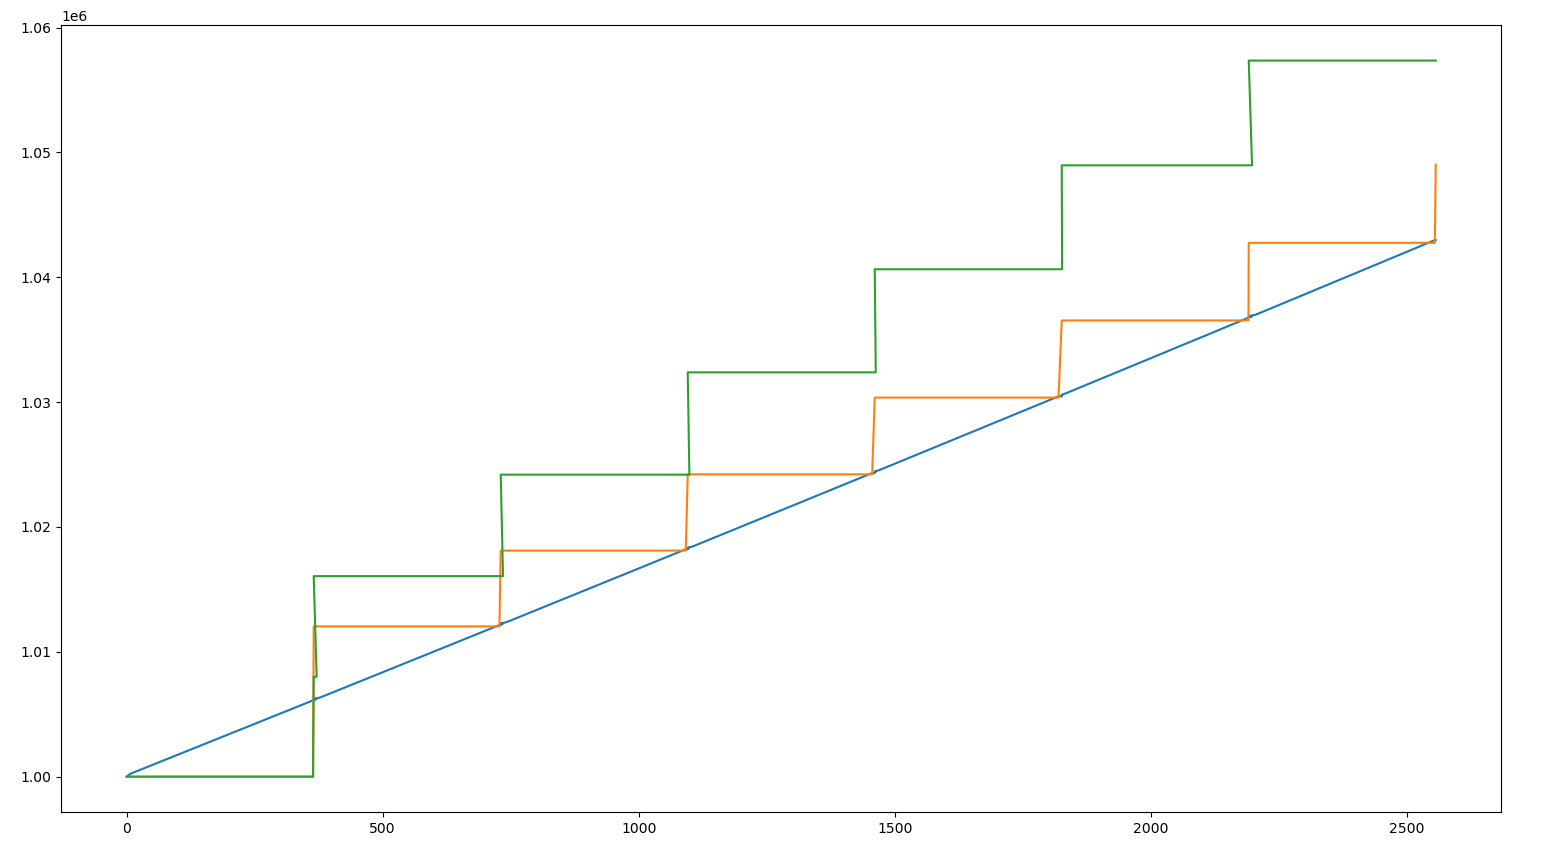
There is still a lot wrong with this code. Below is the result from running the code, which is very different from what I should be getting.

It’s almost 2 months since I started this project, which should’ve taken weeks at best. Same goes for this log, taking about 20 days to finish up. I could’ve been making more progress with studies if this was already over with. But on the bright side, I’m learning a lot more than I expected myself to through this weird little project. I hope to be done with it by this month at maximum so I can go back to learning Kivy.
Summary
- I learned how IEEE 754 precision floating point is created.
- dictionary data values should be represented in functions if needed to make code more readable.
- Focus, and study hard.